|
|
|
|
Let's say you have something like this: x < 4
What are some of the possible values you could have for x? 2, 3, 1, -7, …
|
|
|
|
The answers are infinite! The answers to an inequality are called the solution set.
An easy way to show the answer is to graph the solution set as a number line.
|
|
|
|
 |
|
|
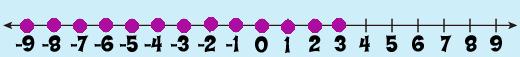
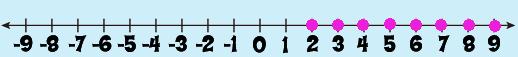
If you start plotting the points that fit the solution, you would get something that begins to look like…Can you see the line beginning to form?
|
|
|
|
|
Now, the only thing is, the x is less than 4 but not including 4. So, when you actually draw your line, you would draw an OPEN circle at the 4. This shows your solution does NOT include 4. Your number line would look like:
|
|
|
 |
|
|
|
What if you have something like: x – 5 ≥ -3
First, how would you solve it? Think of the inequality sign as an equals sign (let's just change it to an equals sign for now) so you can see what I mean). Then I bet you can solve it easily.
|
|
|
 |
|
|
|
 |
|
|
|
Solve for x like you normally would.
Then, at the end, just go back and replace the = with the ≥. Voila!
|
|
|
|
 |
|
|
|
 |
|
|
|
|
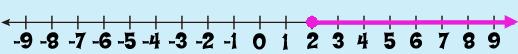
Now, to graph your solution set on the number line…Let's see.
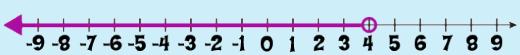
First of all, we know that x can = 2. But, x can also be > 2. So, if we start plotting points, the number line would look like:
|
|
|
 |
|
|
|
|
Since the inequality symbol is ≥ the circle is colored IN when drawing the line.
|
|
|
 |
|